Transform Complex Data with Lotus Style Infographic Templates
Visual communication is more than just pretty pictures; it is about clarity. When you are trying to explain a multi-layered process or a central concept with branching ideas, a linear list often fails to capture the relationship between elements. This is where the Lotus Style Infographic Templates come into play. Modeled after the unfolding petals of the lotus flower, this design approach offers a unique, organic way to visualize data that radiates from a central core. Whether you are a project manager, a health coach, or a graphic designer, this resource provides a distinct visual language that is both calming and structurally sound.
The Power of the Branched Circle Structure
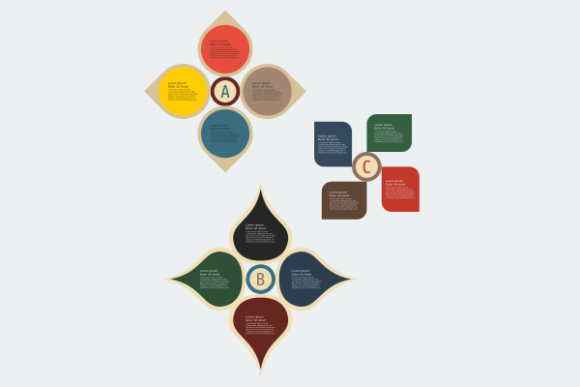
At the heart of this collection is the editable SVG vector of branched circle infographic templates with lotus style. The design philosophy here is rooted in radial hierarchy. Unlike a standard pie chart, which merely shows percentages, the lotus style suggests growth and expansion. The central circle acts as the nucleus or the main topic, while the surrounding "petals" or branches represent sub-topics, stages, or supporting arguments.
This structure is incredibly effective for explaining cyclical processes or interconnected systems. For instance, if you are mapping out a customer journey, the center represents the customer, and the petals can represent different touchpoints like awareness, consideration, purchase, and advocacy. Because the elements are connected but distinct, it allows the viewer to see the big picture without losing the details of the individual components. The aesthetic is professional yet approachable, making it suitable for corporate boardrooms and creative workshops alike.
Practical Scenarios for the Lotus Style
The versatility of these templates extends far beyond standard business presentations. We have seen users adapt the lotus style for a variety of creative and professional needs. Here are a few real-world situations where this specific visual approach shines:
Corporate Strategy and Team Building
In a corporate setting, the lotus diagram is perfect for organizational mapping. Imagine you are illustrating the core values of your company in the center, with the petals representing how those values manifest in different departments—HR, Sales, Product, and Support. It creates a visual metaphor for unity in diversity. Additionally, for team-building exercises, you can use the template to map out individual strengths that contribute to the central goal of the team.
Health, Wellness, and Mindfulness
Given the organic origin of the name, it is no surprise that these templates are a favorite in the wellness industry. Nutritionists often use branched circles to create "Holistic Health" infographics. The center might be "Wellness," with branches detailing Nutrition, Sleep, Movement, and Mental Health. The soft lines and balanced symmetry of the lotus style subconsciously promote a feeling of balance and harmony, which is exactly the message a wellness brand wants to convey.
Education and E-Learning
Educators find the Lotus Style Infographic Templates useful for breaking down complex subjects. In biology, a lotus-style diagram can illustrate the parts of a cell or the stages of mitosis in a way that feels less clinical and more engaging. For language teachers, the center could be a root word, with petals showing prefixes and suffixes. It turns rote memorization into a visual association exercise.
Data Visualization and Reports
When presenting quarterly reports, bar charts can sometimes feel stale. Using a branched circle allows you to highlight a central KPI (Key Performance Indicator) and show the various contributing factors. For example, the center is "Revenue Growth," and the petals show "New Clients," "Upselling," "Marketing Campaigns," and "Referrals." This helps stakeholders immediately understand the drivers behind the numbers.
Why Editable Vectors Matter
One of the most critical features of this resource is that it is an editable SVG vector. But why does this matter to the average user? The answer lies in scalability and customization.
When you download a standard JPG or PNG, you are stuck with a fixed resolution. If you try to stretch it for a large banner, it becomes pixelated and blurry. An SVG (Scalable Vector Graphic), however, is built on code, not pixels. You can scale a branched circle infographic to the size of a billboard or shrink it down to a business card, and the lines will remain perfectly crisp.
Furthermore, "editable" means you are not trapped by the original designer's color palette. If the template comes in pastel blues but your brand uses bold reds and charcoal greys, you can change every single element. You can move the branches, resize the text areas, and even alter the shape of the petals to fit your specific content needs. This level of control is essential for anyone trying to maintain brand consistency across their marketing materials.
Software Recommendations and Workflow
While these files are compatible with various design programs, the documentation suggests that it is better to use Inkscape software for editing. Inkscape is a free, open-source vector graphics editor that is incredibly powerful, especially for users who do not want to invest in expensive subscriptions like Adobe Illustrator.
Because the templates are provided as SVGs, Inkscape handles them natively without conversion issues. You can easily ungroup elements, change font properties, and manipulate nodes. For a beginner, this is a low-risk way to start learning vector design. The workflow is simple: open the file in Inkscape, select the text to type your own data, change the colors to match your brand guide, and export.
Comprehensive File Formats
Understanding that different workflows require different tools, this package is robust. You will also get EPS, PDF and high resolution PNG raster in the attached ZIP.
- EPS: Ideal for professional printers or users of older vector software like CorelDRAW.
- PDF: Perfect for sharing the design with clients who just need to view it or for printing directly.
- High-Resolution PNG: Essential for web use, social media posts, or inserting into PowerPoint presentations where vector editing isn't possible.
This multi-format approach ensures that whether you are building a website, printing a flyer, or emailing a proposal, you have the right file type for the job.
Alternative Uses: Beyond the Infographic
While the primary function is data visualization, the aesthetic of the lotus style is versatile enough for other applications. Graphic designers often repurpose these branched circles as decorative elements.
Background Patterns: By isolating a single "petal" or the central circle and repeating it, you can create a subtle, professional background pattern for websites or stationery.
Banner Design: The radial nature of the design draws the eye inward, making it an excellent focal point for web banners. You can place your main headline in the center and use the branches to list features or benefits of a product.
Social Media Content: Instagram and Pinterest favor vertical or square, eye-catching graphics. A lotus-style breakdown of "5 Tips for Productivity" is more likely to be shared than a plain text post. The structure forces you to be concise, which is perfect for social media consumption.
Considerations Before You Start
Before diving into editing, keep a few practical considerations in mind to ensure your final product looks polished.
Content Density: The lotus style works best with concise text. If you try to cram a full paragraph into one of the petals, the design will lose its elegance. Plan your content to be punchy—bullet points or short phrases work best.
Color Psychology: Since the design is organic, clashing neon colors might look jarring unless that is a specific stylistic choice. Consider using analogous color schemes (colors next to each other on the color wheel) to maintain the harmonious feel of the branched circle.
Font Selection: While you can change the fonts, ensure they remain legible. Sans-serif fonts generally work well for the data points in the petals, while a serif or display font can be used for the central title to create contrast.
Ultimately, the Lotus Style Infographic Templates